UK vinyl sales have continued to surge ahead during 2026. It follows strong growth of 13.3% in 2025, up to 7.6 million units, based on BPI figures.
Against this backdrop, the music industry is putting a greater emphasis on the environmental impact of record production. The Music Climate Pact’s latest research identifies opportunities to reduce manufacturing emissions by up to 60% through material choices and production processes.
As the COP31 United Nations Climate Change Conference kicks off in Antalya, Turkey, Key Production Group has developed Understanding Record Manufacturing Emissions, a practical guide translating industry-average record manufacturing carbon data into everyday comparisons. The guide aims to help artists, labels, creative teams and consumers better understand the figures behind different production routes.
Rather than ranking formats, the infographic aims to encourage more informed conversations about materials, manufacturing and supply chains, highlighting the importance of product-specific data when planning physical releases.
The guide translates industry-average record manufacturing data into familiar everyday comparisons, helping creative teams bring clearer questions into conversations about materials, production routes and release planning.
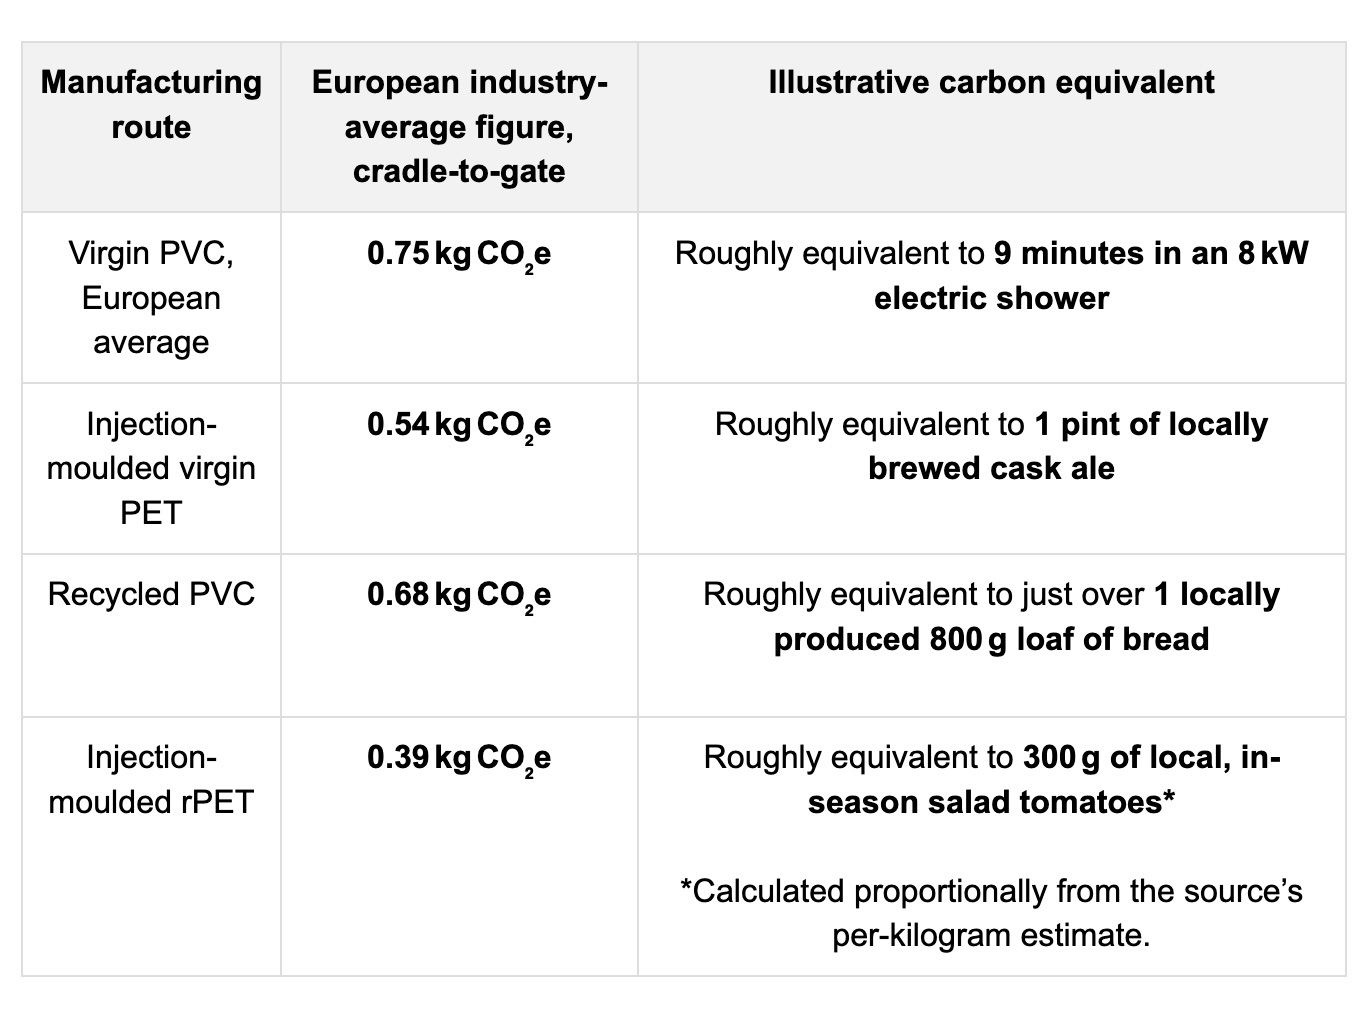
The ‘Cradle-to-gate’ measurement covers raw materials and manufacturing up to the point the packaged record leaves the factory assessed by the Music Climate Pact/Vinyl Alliance. It is based on 140g, 12-inch record configuration and includes the record, paper inner sleeve, cardboard outer sleeve and shrinkwrap.
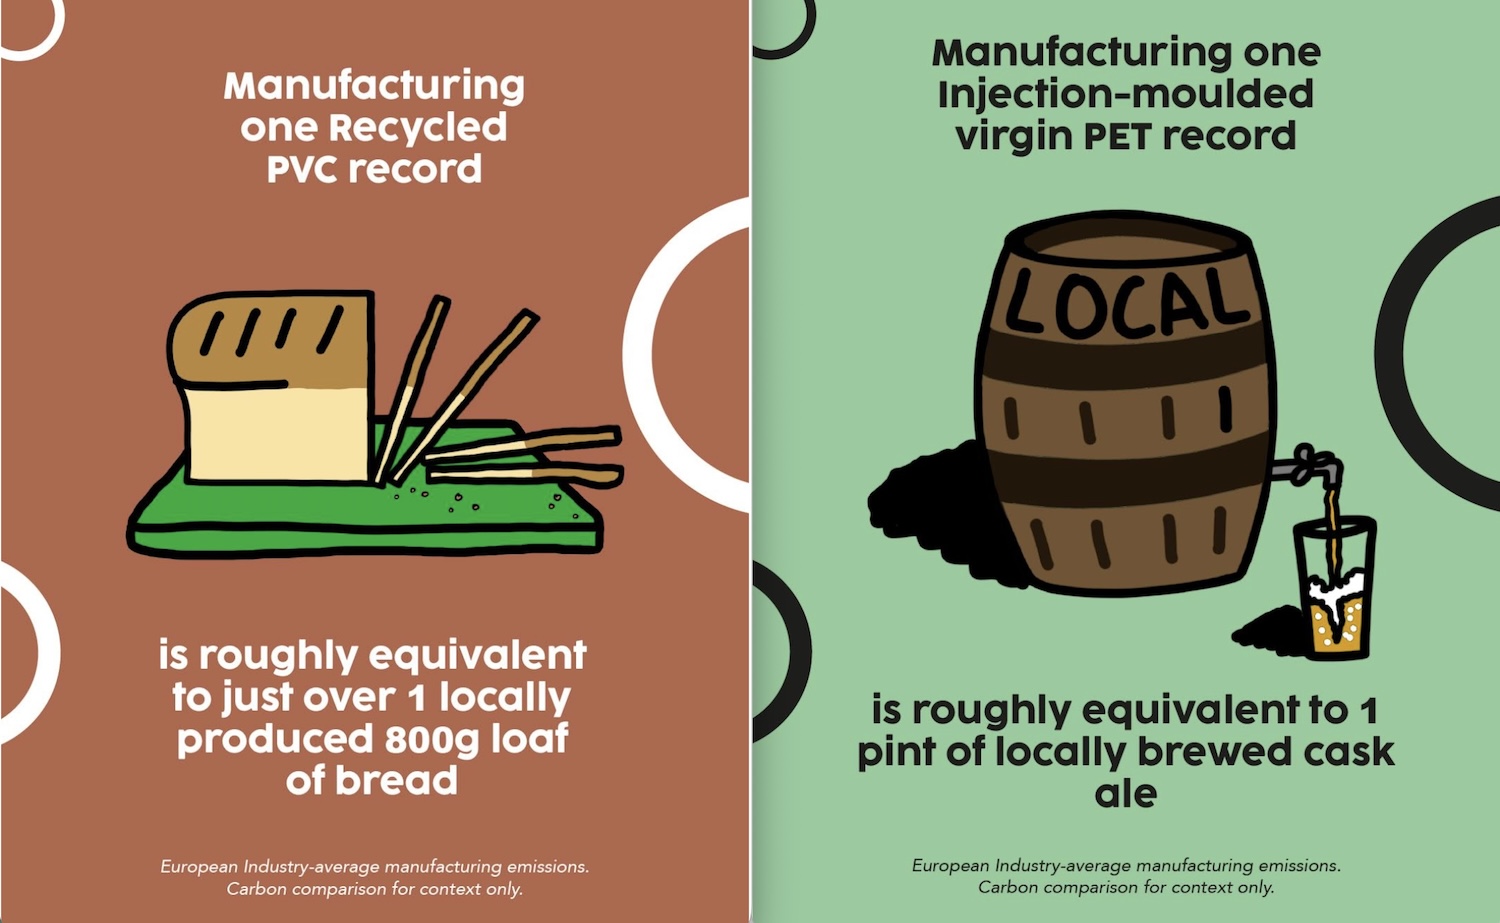
The comparison is illustrative of carbon context only, not a like-for-like lifecycle comparison. Later distribution, use of the record and end-of-life are excluded.
While it does not claim that one individual release will have the same footprint as an industry average, Key Production said it provides a practical starting point for asking better questions and requesting product-specific data.
John Service, sustainability and strategic planning director, said: "Carbon figures can be pretty abstract. Saying a record has a footprint of so many kilos of CO2e doesn’t necessarily mean much unless you work with this stuff every day. The work we’ve been doing through the Music Climate Pact has helped build a much better picture of the carbon footprint of physical music, and we wanted to find a simple way of putting some of those numbers into everyday context.
“This isn’t about saying one type of record is good and another is bad. There’s much more that goes into the footprint of a release than the material alone. For me, the important thing is that we’re moving the conversation on from assumptions. Better data means artists, labels and the wider industry can understand where the impacts actually are and make more informed decisions about what they can realistically do about them."
The guide also highlights that carbon is only one environmental indicator. The per-record figures an assessment of overall environmental impact. The everyday comparisons provide approximate carbon context only; they are not like-for-like lifecycle comparisons and do not indicate overall environmental superiority.
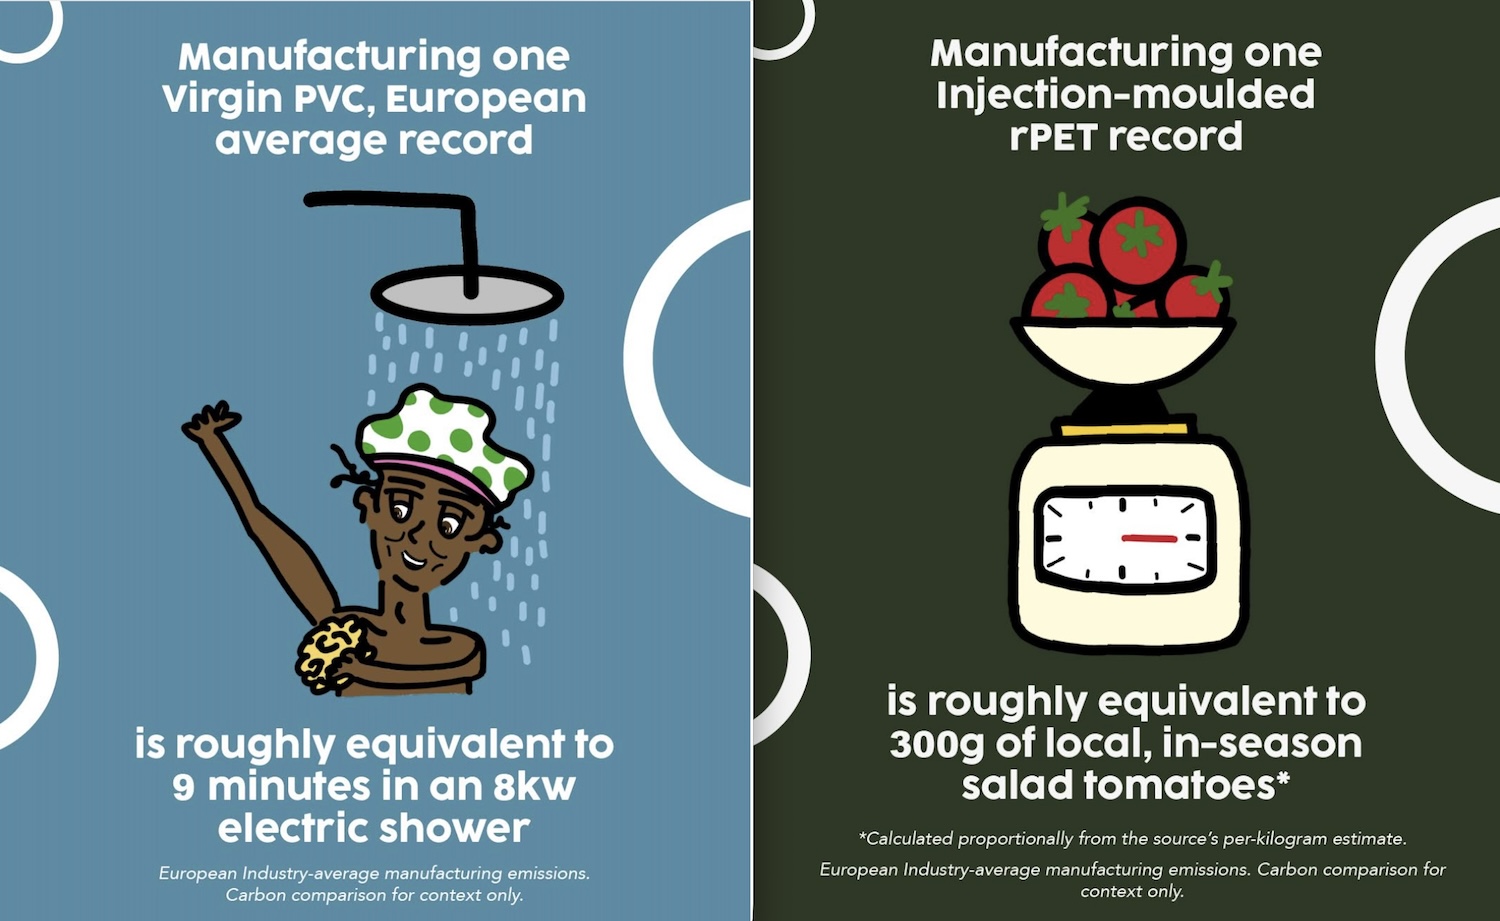
A release’s final climate impact depends on more than the disc material. Record weight, colour, packaging, print finishes, run size, factory location, electricity mix, freight route and distribution all influence the final result.
While industry-average data is a useful starting point, manufacturers can provide product-level information that reflects the actual record specification and proposed supply chain.
The applicable figures depend on material, manufacturing method and region. The guide provides industry-average estimates, not a guarantee of the footprint of a particular plant, supplier, order or release.
Everyday comparisons for the guide use figures from Mike Berners‑Lee, The Carbon Footprint of Everything.